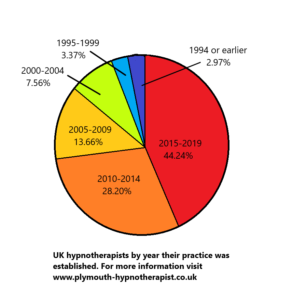
This pie chart is based on original research which I conducted in December 2019. Data was gathered from public registers of the British Society for Clinical Hypnosis, the United Kingdom Council for Psychotherapy, the National Council for Hypnotherapy, and from the Hypnotherapy Directory website. Further research on specific areas of the country suggests that between them these registers and directory cover about 60% of all hypnotherapists advertising on Google. Where not stated explicitly on their website, the age of each practice was estimated from the earliest capture of their website on the Wayback Machine. Comparison with my ongoing survey of all new hypnotherapists appearing in my own area since 1993 suggests this is a valid means of approximating the age of a site, although the Wayback Machine may take a year or so to find a new site.
The most striking result of this survey is the very large percentage of hypnotherapists who have been in practice for only a short while. My unpublished ongoing research into hypnotherapists coming and going within my local areas suggests that this is due to a very high turnover in the profession, with most new hypnotherapists going out of business within a few years.
From the same database I have also created a map showing the distribution of hypnotherapists in different parts of the UK.
This chart may be copied or linked to on any website so long as a link back to my own website https://plymouth-hypnotherapist.co.uk is added.